Building Usage Scheduler
BuroHappold Engineering is an international multi-disciplinary engineering firm that works with premier contractors and architecture firms to make ambitious building plans a reality. While working with the Sustainability Team at BuroHappold’s New York City offices in summer 2014, I spearheaded several initiatives to bring data-driven approaches to the company’s workflow.
One such project was this building usage scheduler. A common task for clients is to send information on the projected daily use of a building to the Sustainability Team for use in energy modeling. The current workflow is cumbersome. I was tasked with imagining and prototyping a new web system allowing clients to provide scheduling information to the Sustainability Team.
How it works
By studying the current ways of providing scheduling information to BuroHappold and the ways that the Sustainability Team inputs scheduling data into their modeling system, I developed a three-tiered approach.
- Create daily schedules for different day types.
- Create weekly schedules composed of different day types.
- Create yearly schedules composed of different week types.
The project was given only a few days, but I developed working proofs of concept for the first and second tiers. Though they do not interact with each other yet (day types defined in the prototype cannot be used in the weeks), the proof of concept was very well received by the team. Some even suggested I develop an offline version for internal use. (I did not have an opportunity to do so.)
On the daily scheduling page, users can click and drag hours to modify the occupancy levels (as a percentage of capacity) throughout the day. The save button writes the updated information to a file on the server using a Ajax request and a PHP script on the server. (The plan was to set up alerts to be sent to BuroHappold email addresses when files on the server were modified.)
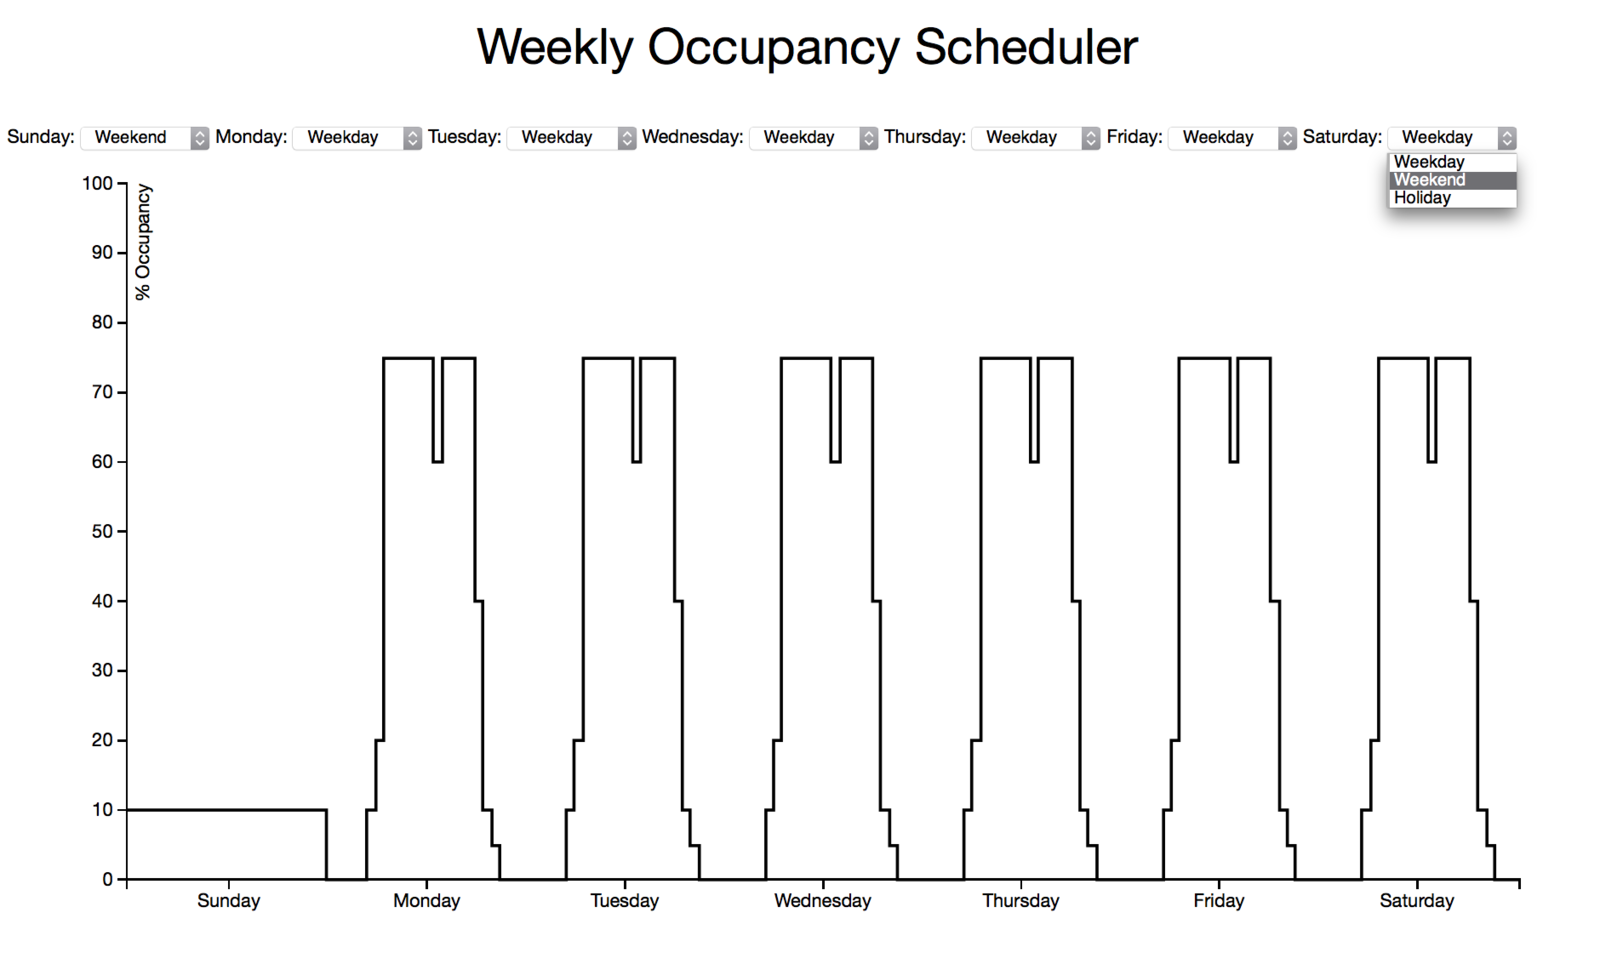
On the weekly scheduling page, selecting different “day types” from the dropdown menu changes the shape of the line according to the schedule for the day types. I did not have time to implement a save functionality for this interactive tool.
Example
Daily scheduler
The opening screen is a visualization of the occupancy level by time of day.
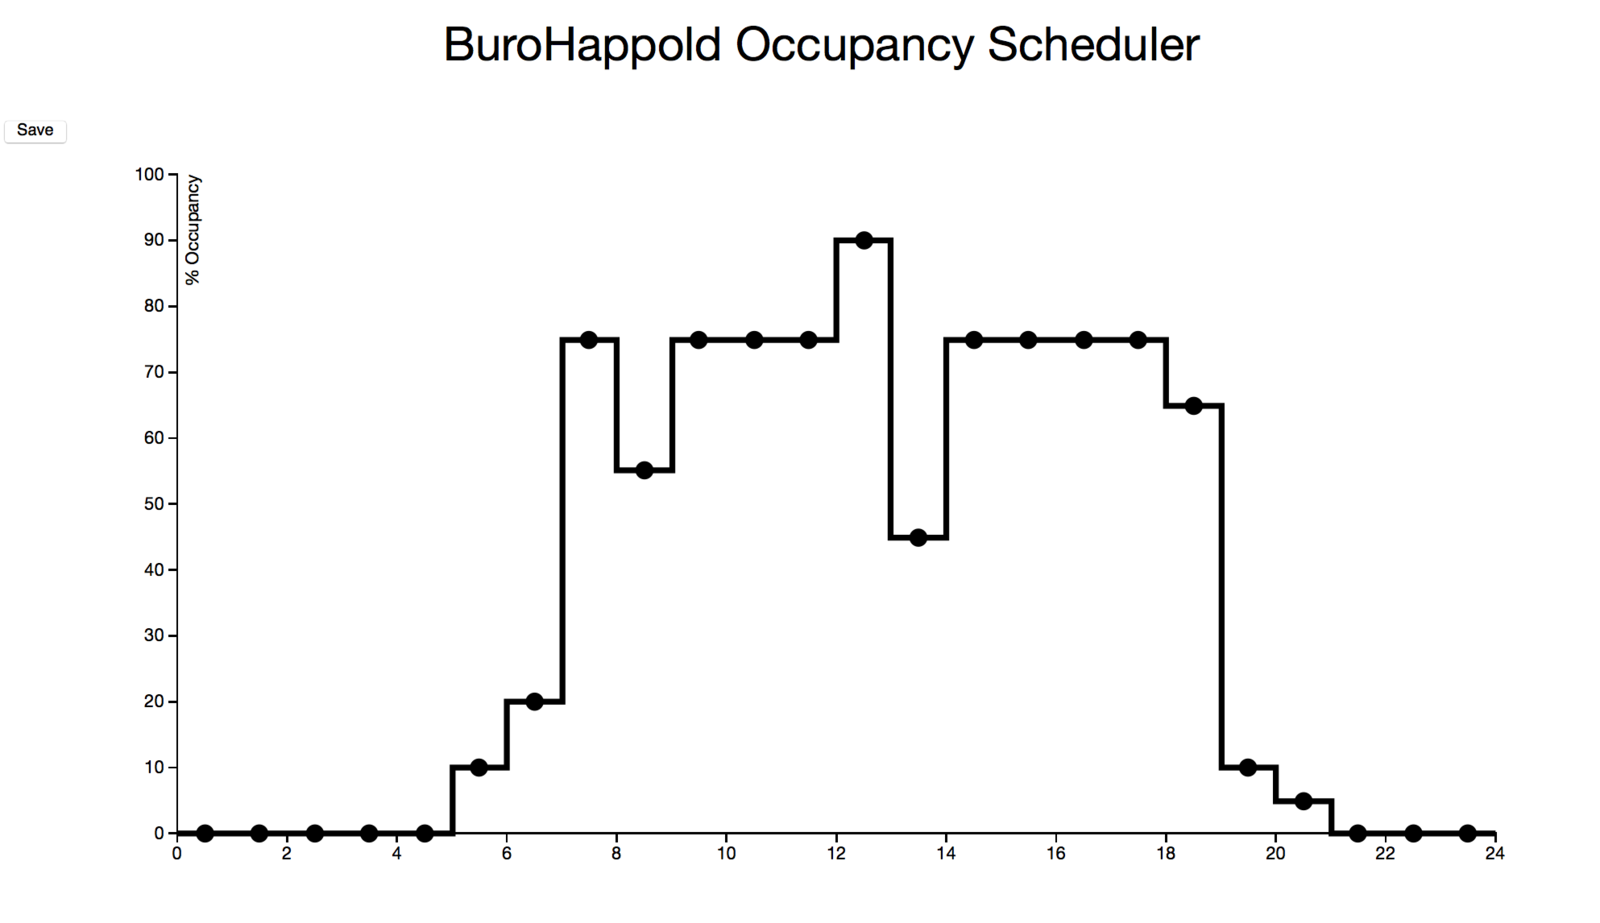
Users may drag the circles to change the occupancy levels of hour intervals.
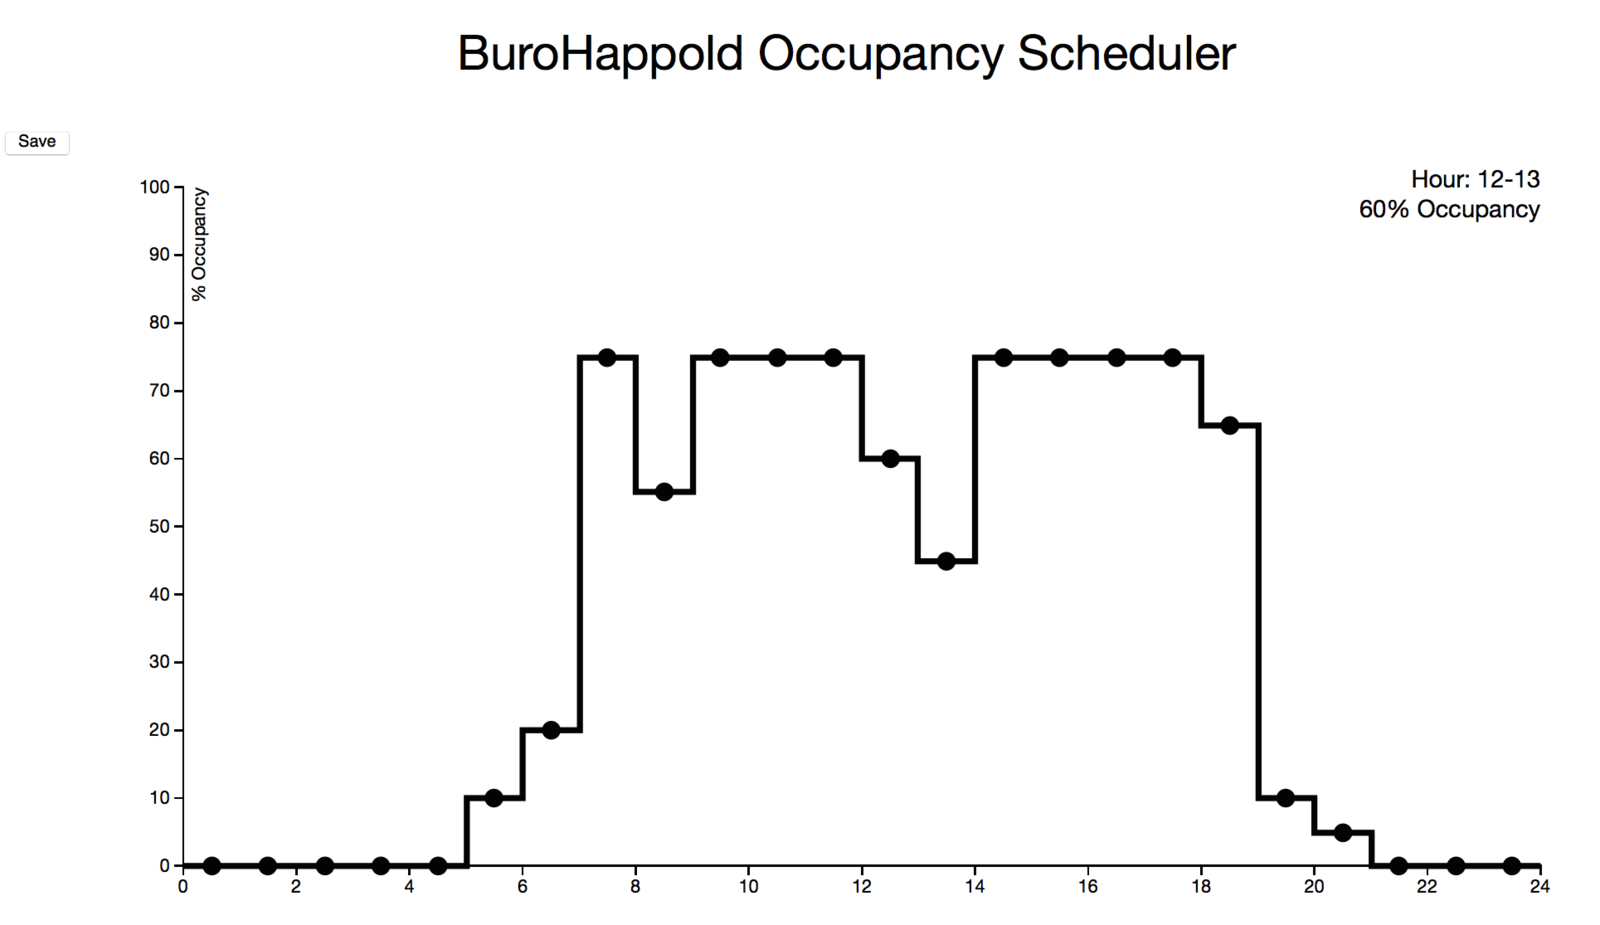
Pressing the save button sends an Ajax request to write the changes to the server.
Weekly scheduler
The opening screen is a visualization of the occupancy levels over the course of the week.
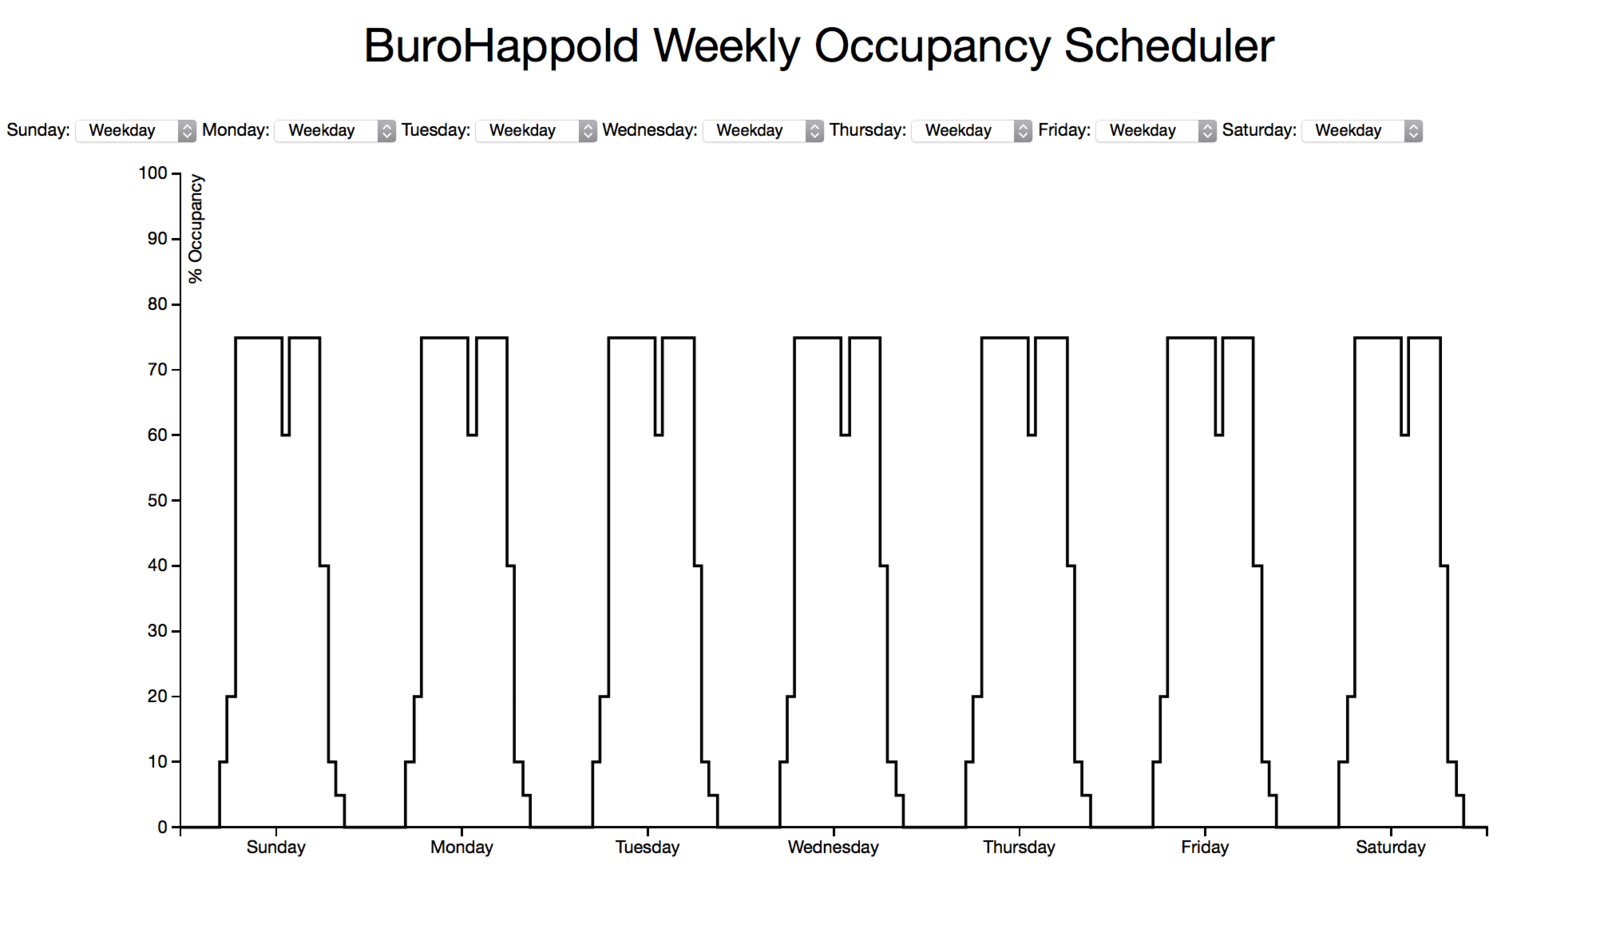
Users may click drop-down menus to change the day type for each day of the week.
Why it matters
This tool is an example of interactive design that allows the user to both explore and contribute information. Because users are able to modify the graphic and submit responses to the server, the technology could be used as a graphically-driven survey, which is especially useful for providing complex, unintuitive information. The graphic facilitates interaction between organizations and their users.
Technologies
- Javascript + d3.js
- HTML
- CSS
- PHP